Average Assessment Score (Graph)
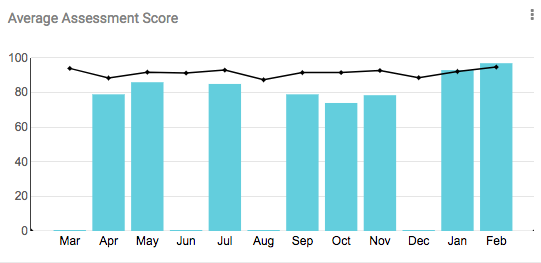
The graph above provides a visual representation of how your stores are performing (bar charts) vs how the organization is performing (line graph) over the selected time period. In the example above we are analyzing a years worth of data, and we can quickly see that our assigned stores are performing below the organizations averages.
By hovering over different areas on the graph, we can identify the scores for a particular time period. For example, below we can see that in the month of July our stores had an average score of 85% which was slightly below the organizations average score of 93%.


Pro Tip: Clicking the three small dots in the top right corner will allow you to toggle between the monthly and weekly view. The weekly view will only be available if the timeframe is set to one month or less.
